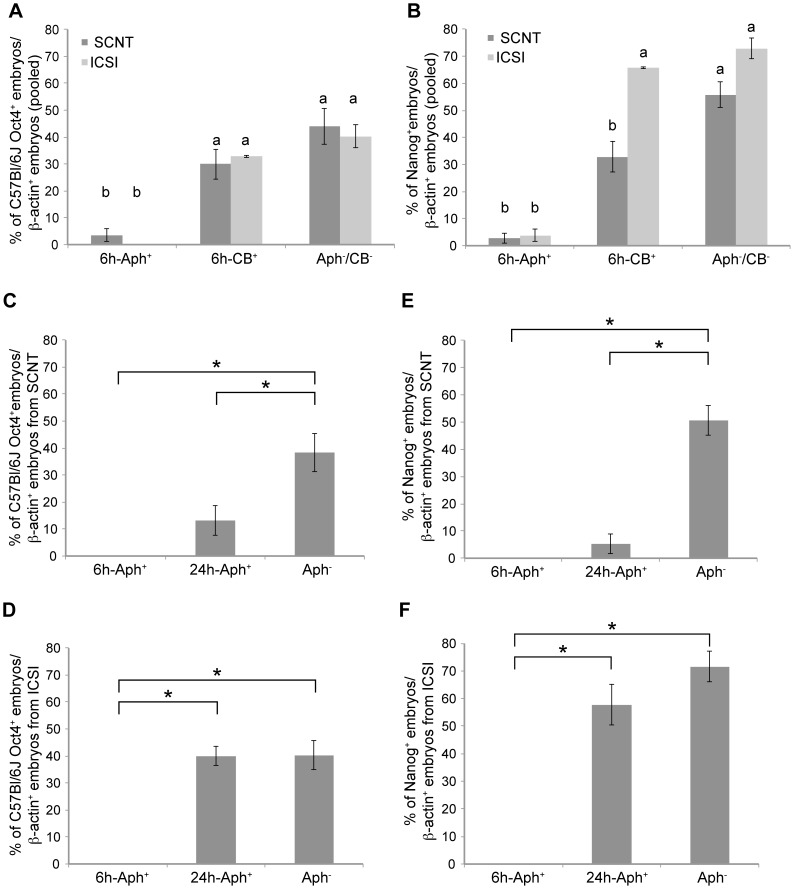
Figure 5. Results of individual embryos analyzed by allele-specific PCR for Oct4 and Nanog mRNA.
(A) Pooled frequencies of Oct4 and (B) Nanog mRNA expression in SCNT or ICSI embryos after treatment with Aph or CB from 6 hpa. (C) Frequencies of Oct4 mRNA expression in SCNT embryos after treatment with Aph or CB from 6 or 24 hpa. (D) Frequencies of Oct4 mRNA expression in ICSI embryos after treatment with Aph or CB from 6 or 24 hpa. (E) Frequencies of Nanog mRNA expression in SCNT embryos after treatment with Aph or CB from 6 or 24 hpa. (F) Frequencies of Nanog mRNA expression in ICSI embryos after treatment with Aph or CB from 6 or 24 hpa. All of the abovementioned embryos tested positive for β-actin mRNA. Statistical significance was calculated using chi-square test with p≤0.05.

