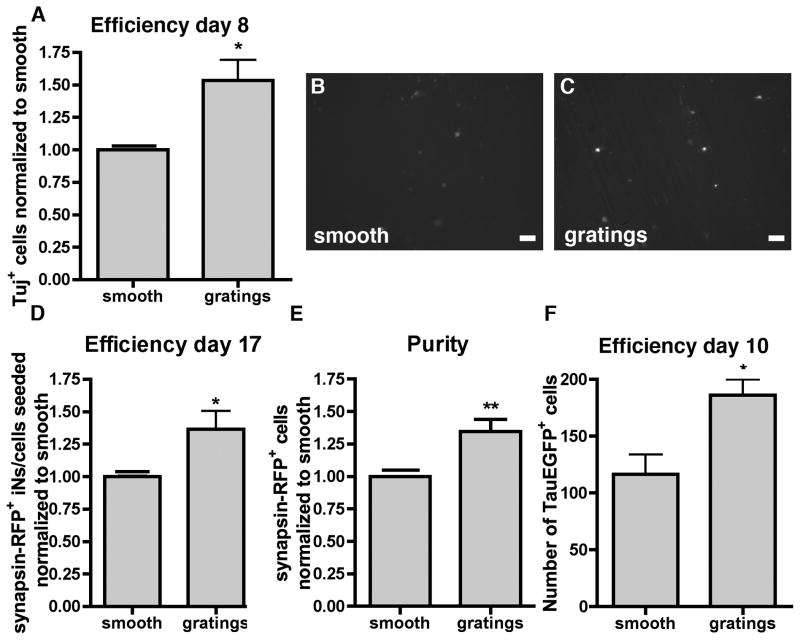
Figure 2. Increase of grating topography on iN generation.
(A) Quantification of the number of Tuj+ cells on grating substrates normalized to smooth substrates. Images of synapsin-RFP+ iNs on (B) smooth and on (C) gratings substrates. Scale bar 50 μm. (D) Efficiency of iN defined as the ratio of synapsin-RFP+ iNs to cells seeded and normalized to smooth substrates. (E) Quantification of iN purity defined as the ratio of synapsin-RFP+ cells to the total number of cells sorted normalized to the percentage of synapsin-RFP+ cells on smooth substrates. (F) Number of Tau-EGFP+ iNs at day 10. All data displayed as mean ± SEM.

