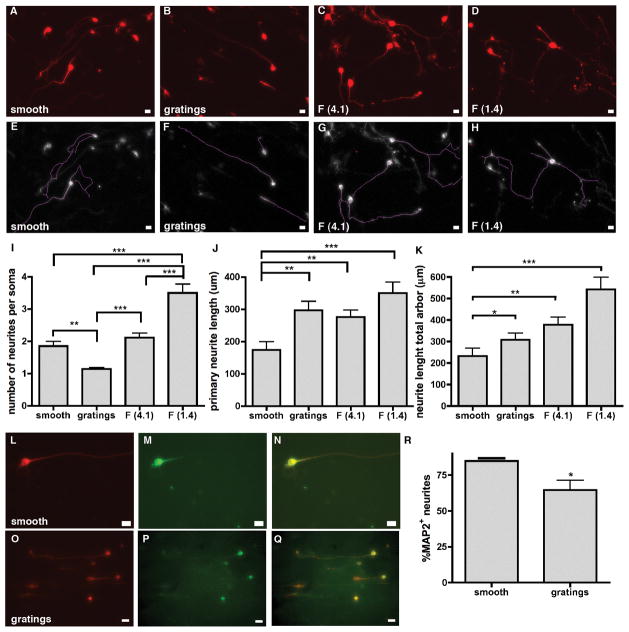
Figure 3. Influence of substrate topographies on neurite branching and outgrowth of Tuj1+ iNs.
(A–D) typical images of iNs on different topographies with neurites stained by Tuj1. Scale bar 10 μm. (E–H) Traces of neurites from widefield microscopy images obtained using Fiji. (I) Quantification of the number of neurites per cell soma. iNs on grating topography displayed significantly less neurite extensions per cell soma compared to smooth, F (4.1) and F (1.4) topographies, whereas neurites of iNs on F (1.4) were significantly more branched compared to neurites of iNs on smooth, gratings or F (4.1) topography. Graph shows analysis by a global one-way ANOVA with Dunn’s posthoc testing (** p < 0.01; *** p < 0.0001). (J) neurite outgrowth determined by the length of the primary path and (K) total neurite arbor was significantly enhanced on gratings, F (4.1) and F (1.4) topographies compared to neurites of iNs on smooth control substrates. Graph shows analysis by a global one-way ANOVA with Dunn’s posthoc testing (* p < 0.05; ** p < 0.01; *** p < 0.001). (L,O) Tuj staining on smooth and gratings substrates; (M,P) MAP2 staining on smooth and gratings substrates; scale bar 10 μm (N,Q) overlay of Tuj and MAP2 staining; (R) % of MAP2 expressing neurites. All data displayed as mean ± SEM.

