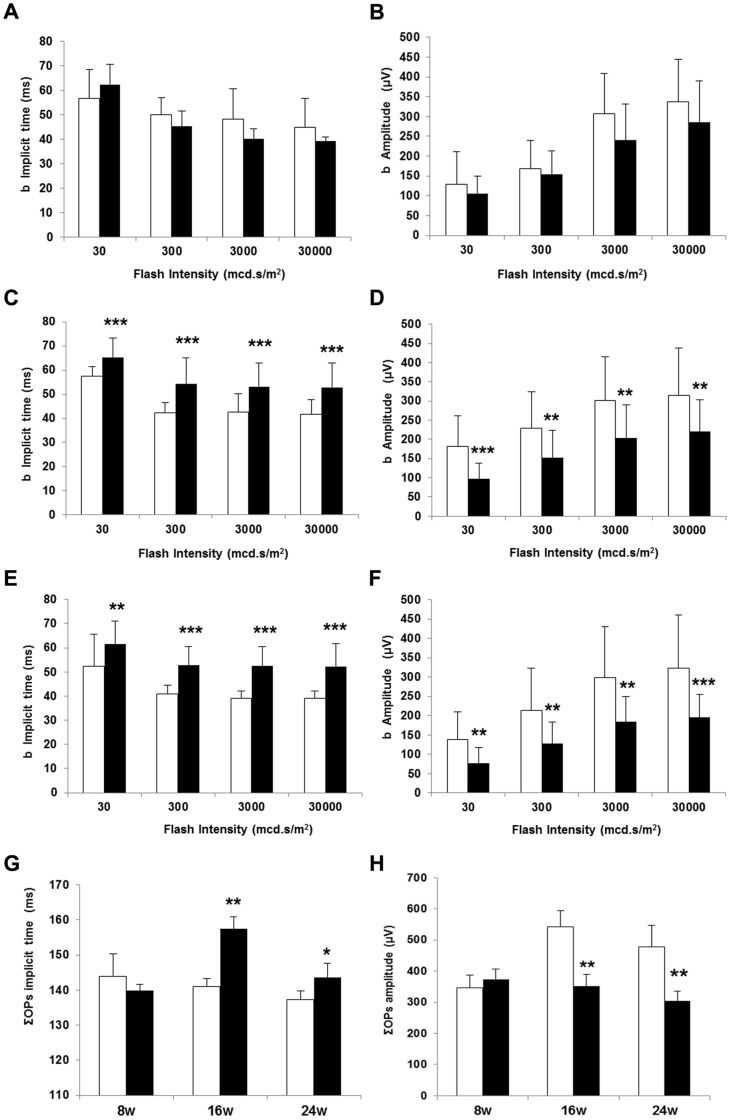
Figure 2.
b-wave implicite time (ms) in non diabetic and diabetic mice at 8 (A), 16 (C) and 24 weeks (E). ΣOPs implicit time (ms) (G). b-wave amplitude (µV) in non diabetic and diabetic mice at 8 (B), 16 (D) and 24 weeks (F). ΣOPs amplitude (µV) (H). White bars: non diabetic mice. Black bars: diabetic mice. Data are expressed as mean ± SD. *p<0.05; **p<0.01;***p<0.001.

