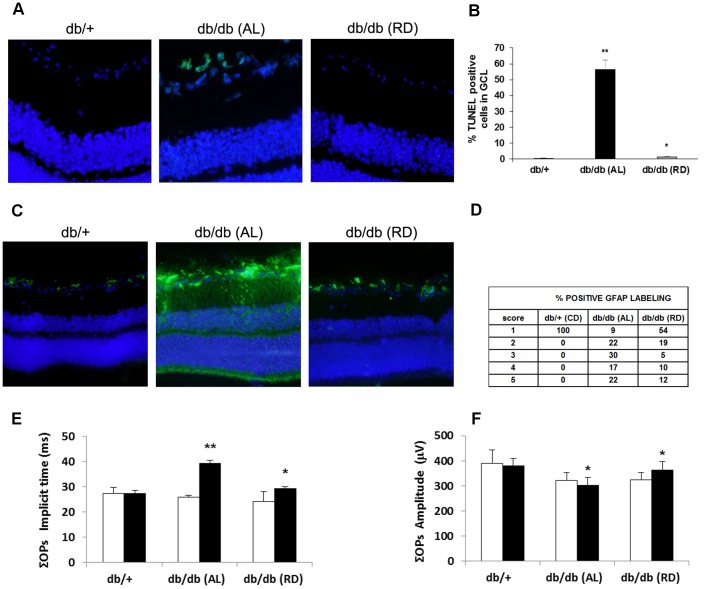
Figure 9. Beneficial effects of lowering blood glucose by using restrictive diet on retinal neurodegeneration in db/db mice.
A) Comparison of TUNEL immunofluorescence (green) between representative samples from a diabetic mouse (db/db) ad libitum (AL) feeding (upper panel), a db/db mouse under dietary restriction (RD) (middle panel) and a control (db/+) mouse (lower panel) at 10 weeks. B) Percentage of TUNEL positive cells in the GCL in db/db mice ad libitum feeding (black bars), db/db mice under dietary restriction (gray bars) and control (db/+) mice (white bars) at 10 weeks. n = 10 each group. *p<0.05 in comparison with db/db feeding AL. **p<0.01 in comparison with db/+. C) Comparison of GFAP immunoreactivity (green) in the central retina between representative samples from a diabetic mouse (db/db) AL feeding (upper panel), a db/db mouse under dietary restriction (middle panel) and a control (db/+) mouse (lower panel) at 10 weeks. Nuclei were labeled with Hoechst (blue). ONL: outer nuclear layer; INL: inner nuclear layer; GCL: ganglion cell layer. D) Quantification of glial activation based on scoring system (see text) (n = 10 each group). E) ΣOPs implicit time (ms) and F) ΣOPs amplitude (µV). White bars: before diet intervention. Black bars: after diet intervention. Data are expressed as mean ± SD. *p<0.05; **p<0.01.

