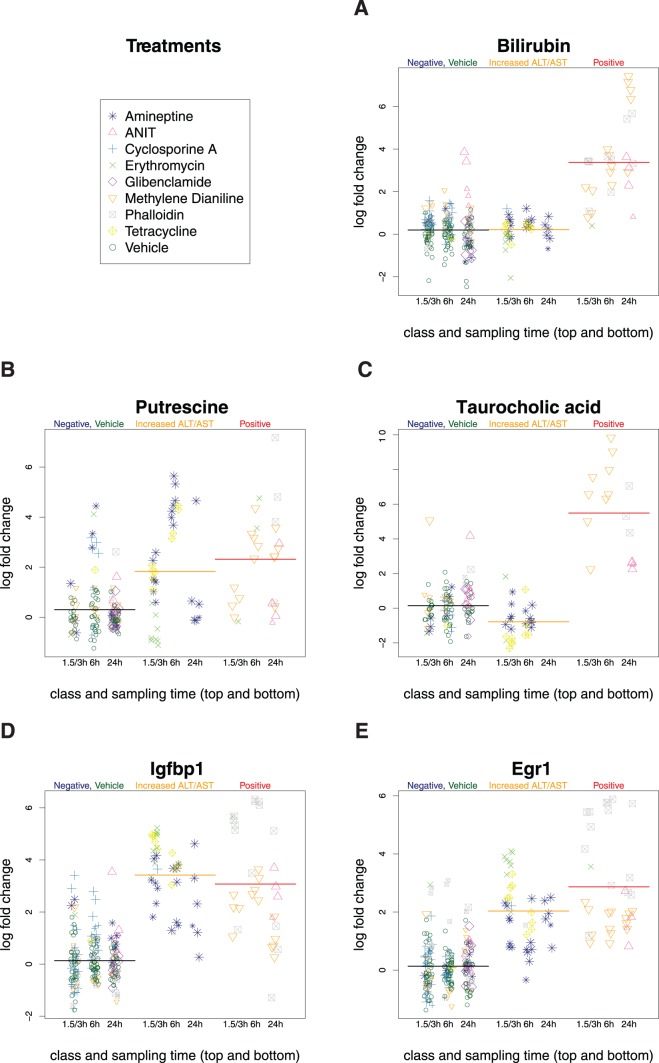
Figure 2. Top Markers.
All measurements are visualized in detail for the 1–2 best ranked markers for each type of parameter (subfigure A: clinical chemistry in serum, B: metabolite in liver tissue, C: metabolite in serum, D/E: transcript in liver tissue). The fold-change of each sample is calculated with respect to the matching control group (vehicle treatment). The mean of each class is shown as horizontal line (black: negative including controls, yellow: increased in ALT or AST, red: positive). The size of the treatment symbols increase with dose. The time points are resolved by aligning the symbols in columns.

