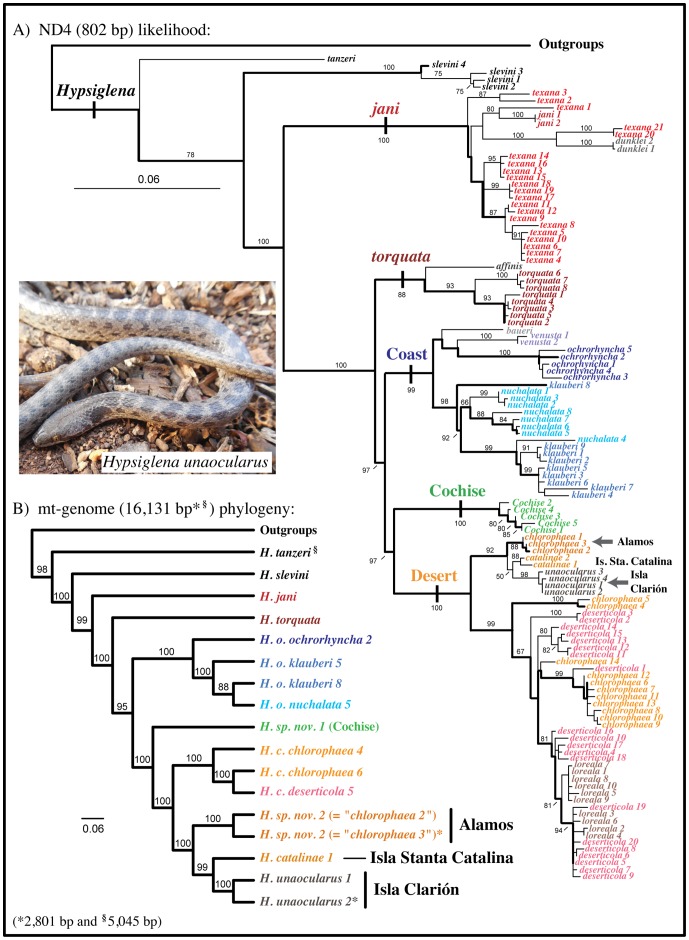
Figure 1. Maximum likelihood phylogenies of Hypsiglena, based on ND4 data (A) and mt-genome data (B).
Thick lines in (A) show backbone-enforced topology (see text), haplotype names and numbers, and clade names are from Mulcahy (2008). Branch numbers represent bootstrap values. Photo of CNAR-IBH 28131 (DGM).

