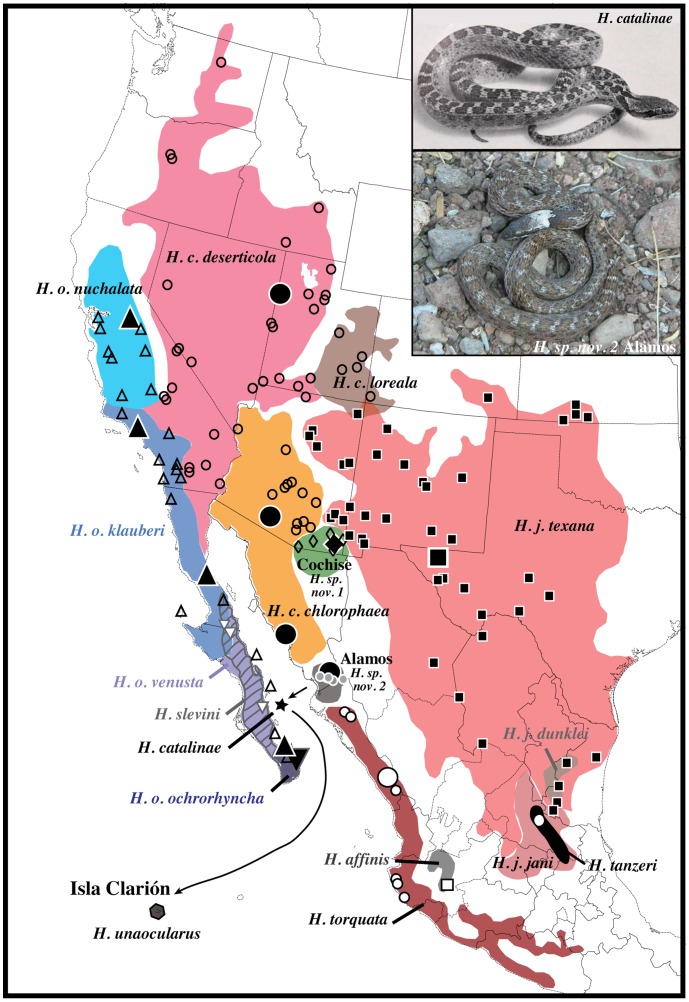
Figure 2. Geographic distribution of Hypsiglena.
Colored ranges match colored clades in Figure 1 and follow prior studies, where details on previously collected samples and taxonomy can be found (Mulcahy 2008; Mulcahy and Macey 2009). Small and large symbols represent ND4 and mt-genome samples. Arrows show colonization from the Alamos area to Isla Santa Catalina (star), then to Isla Clarión (hexagon). Photos: top by D. Clites [26] with permission, bottom UTA-R 54569 (J. Meik).

