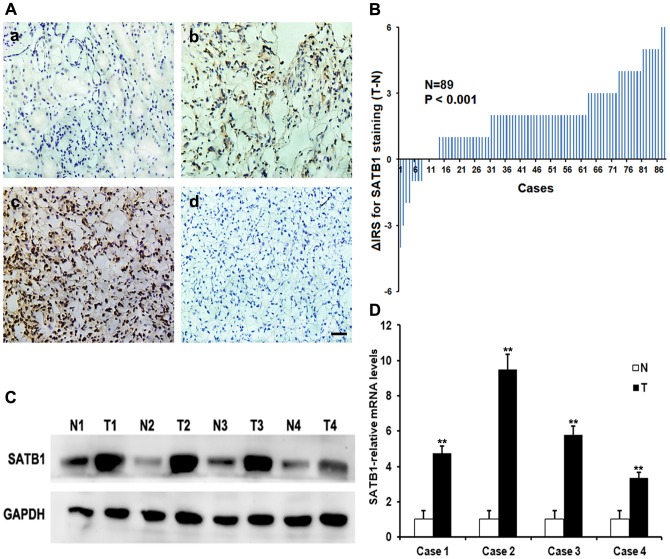
Figure 1. Expressions of SATB1 in human ccRCC tissues and matched non-cancer tissues.
A, immunohistochemical staining for SATB1 in representative sections. (a) Negative or low level staining of SATB1 in paired normal tissue; (b) Moderate staining of SATB1 in tumor tissue; (c) Strong staining in majority of ccRCC cells; (d) Negative control for SATB1 staining in ccRCC tissues. Magnification: 400×. B, The distribution of the difference in immunoreactivity score (IRS) of SATB1 staining. The IRS of SATB1 was obtained from 89 pairs of tissues, and the difference was expressed as ΔIRS = IRST-IRSN (T, tumor tissues; N, matched normal tissues). C–D, Expressions of SATB1 protein and mRNA in four representative pairs of matched normal renal tissues (N) and ccRCC tissues (T) were assessed by western blotting and qRT-PCR, respectively. Scale bar: 10 µM. Data were shown as mean ± SD (n = 3). **P<0.001.

