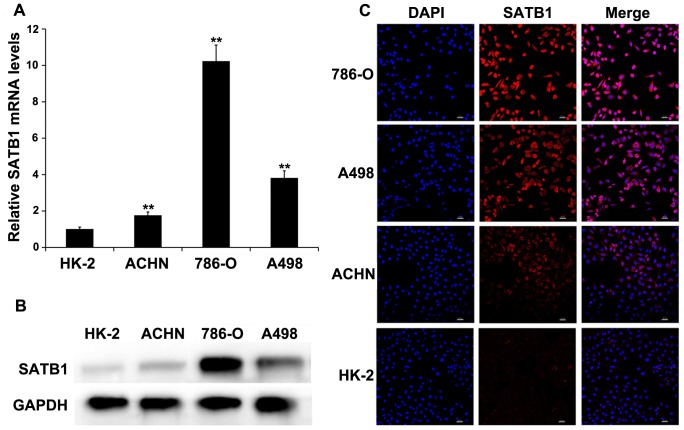
Figure 2. SATB1 expression is correlated with the aggressive phenotypes of renal cancer cell lines.
SATB1 expression in immortalized normal human proximal tubule epithelial cell line HK-2 and three types of RCC cell lines (ACHN, 786-O and A498) was determined by qRT-PCR (A), western blotting (B) and immunofluorescent staining (C; Magnification: 200×), respectively. GAPDH served as a loading control. Scale bar represents 20 µM. Data were shown as mean ± SD (n = 3). **P<0.001.

