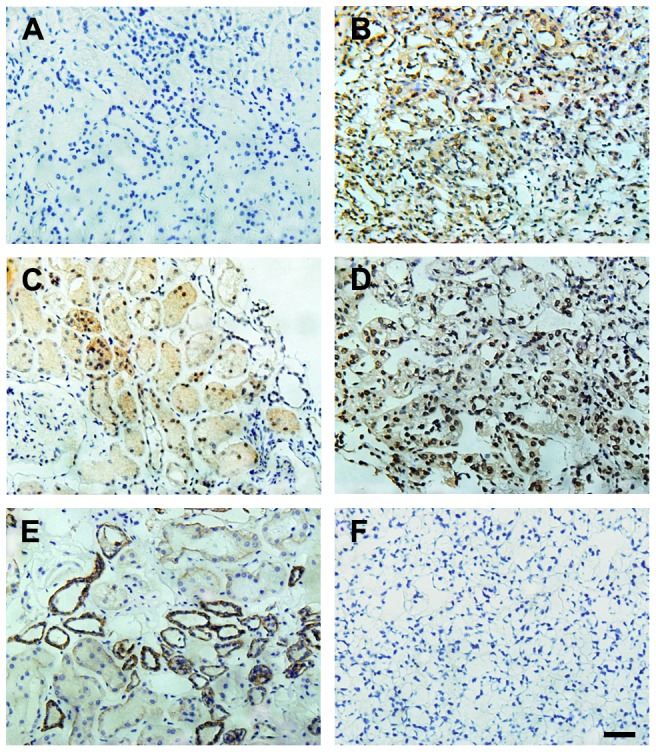
Figure 5. Correlations between SATB1 and EMT markers or SATB2 in ccRCC tissues and paired control tissues.

Negative SATB1 staining (A) and high expressions of SATB2 (C) and E-cadherin (E) were shown in matched normal renal tissues, respectively. Positive SATB1 staining (B) and high ZEB2 expression (D) were observed in ccRCC tissues. (F) Negative control in ccRCC tissues. (Hematoxylin counterstain; Magnification: 400×). Scale bar: 10 µM.
