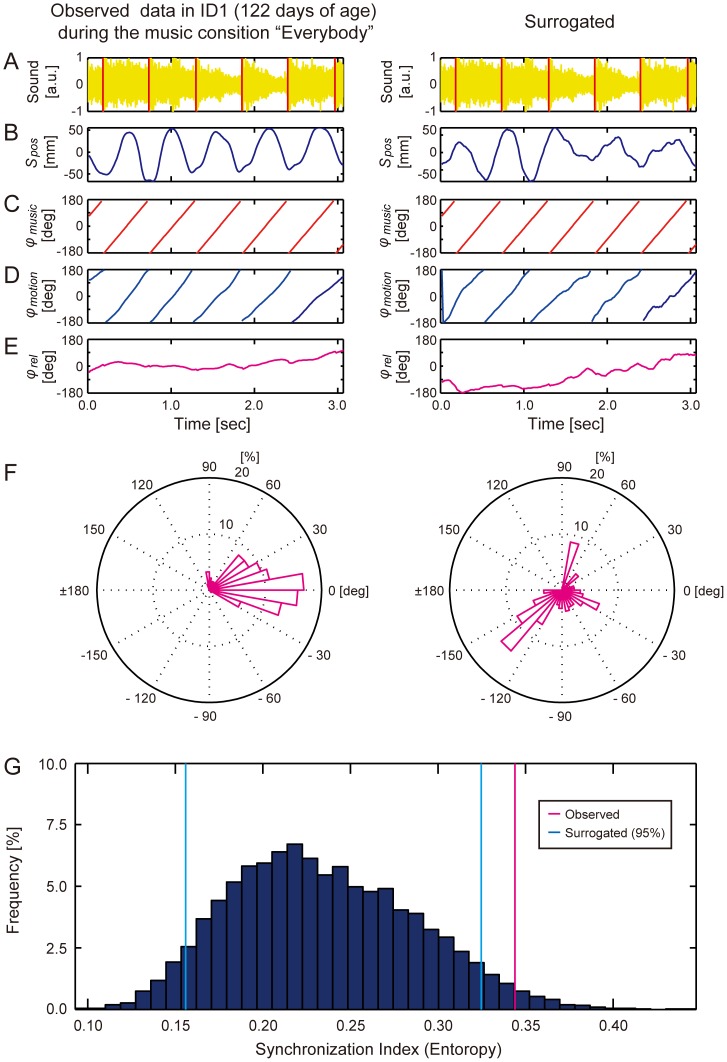
Figure 2. Significant synchronization in right leg movements of ID1 during the music condition “Everybody” (108.7 BPM) (Video S3).
(A) Sound wave of the auditory stimulus (yellow) with the detected beat onsets (red vertical lines). (B) Observed (left) and phase-randomized (right) position data s pos (t) along the Y coordinate axis when the infant moved continuously over a period of three seconds (defined as a moving section). (C) Instantaneous phase of the musical beat φ music (t) calculated from the detected beat onsets. (D) Instantaneous phase of the motion φ motion (t). (E) Relative phase φ rel (t) between motion and the musical beat. (F) Circular histograms of φ rel (t). (G) Monte-Carlo statistics showed that the observed synchronization index (magenta line) was above the 95% confidence interval of the surrogate synchronization indexes (blue lines) calculated from the 10,000 phase-randomized position data: The observed movement was significantly synchronized to the musical beat.

