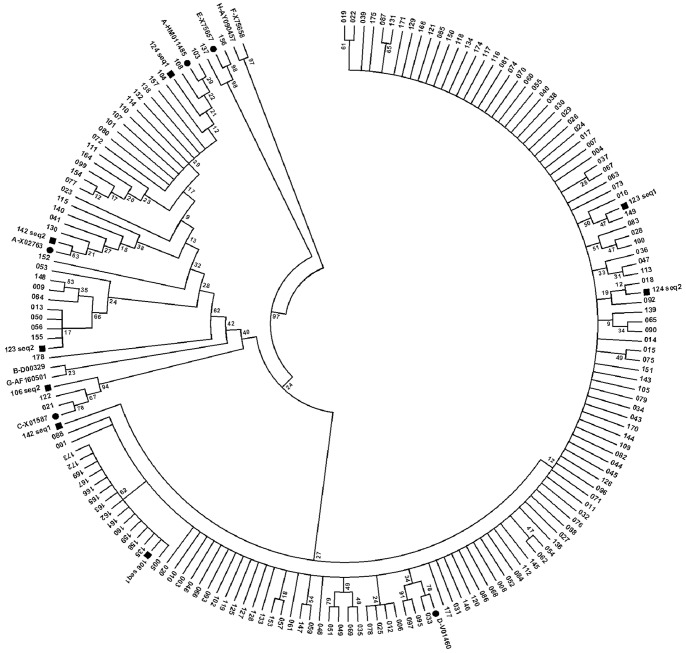
Figure 1. Phylogenetic analysis of Omani HBV strains.
Phylogenetic analysis inferred from distance analysis (Kimura 2 parameters model) and neighbor-joining reconstruction from a partially overlapping region of P and S genes (from nt479 to nt766) of 170 Omani HBV DNA-positive isolates. The reference strains were denoted by HBV genotype and “•” signal with the GenBank accession number, respectively (for example: “A-HM011485•”). The Omani samples were numbered, and especially the double-infected samples were highlighted by the “▪” signal. (The numbers at the nodes indicate bootstrapping values.).

