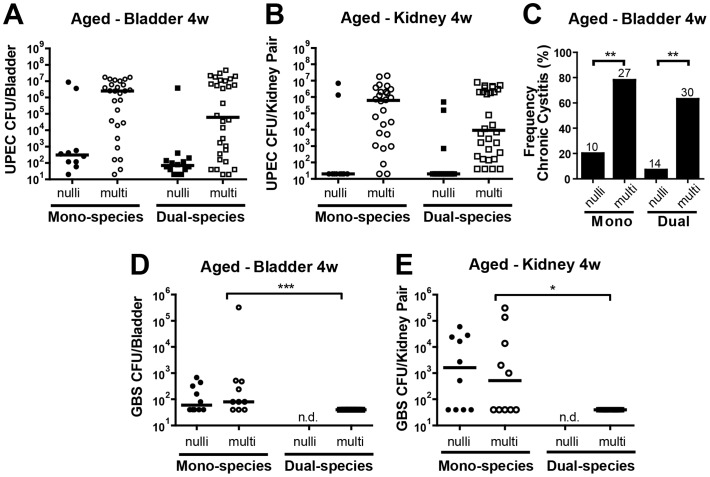
Figure 4. Multiparity is associated with more severe chronic UPEC UTI.
Bacterial CFU in the bladder (A,D) or kidney (B,E) at 4 weeks post infection following infection of C3H/HeN 7–11 month female mice with ∼107 UPEC alone, GBS alone, or ∼107 of each organism simultaneously. For CFU analysis, N = 3–8, at least 5 mice per experiment. The horizontal bar represents the median value for each group of mice. Statistical significance was determined by the Kruskal-Wallis test with Dunn’s post-test for multiple comparisons. * P<0.05, ** P<0.005, *** P<0.0005. N.d. indicates groups in which no data were collected. (C) The percentage of mice displaying >104 CFU/bladder at 4 wpi, indicative of chronic cystitis. The number of mice (n) for each infection group is indicated above the bar. Fisher’s Exact test was used for statistical analysis.

