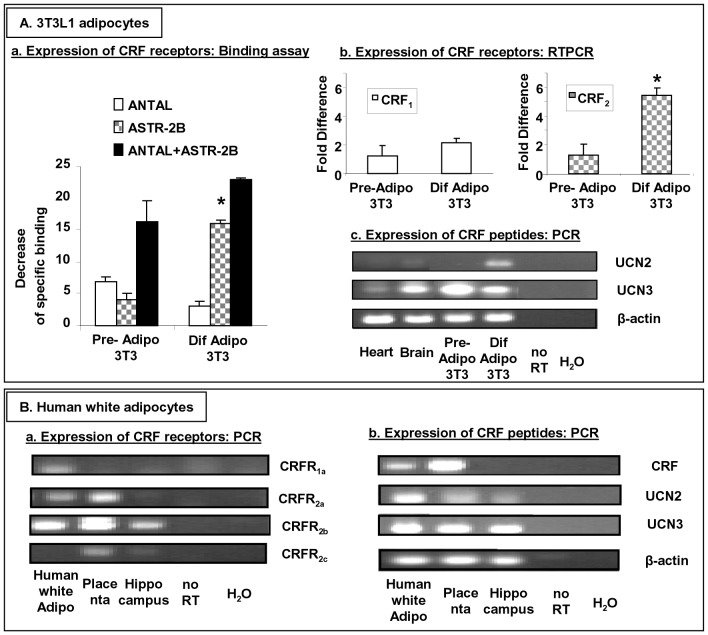
Figure 1. Expression of CRF receptors and peptides in 3T3L1 pre-adipocytes, differentiated adipocytes and human primary white adipocytes.
Panel A, (a), Cells were exposed to antalarmin (a CRF1 receptor antagonist) and/or astressin-2B (a CRF2 receptor antagonist) and the decrease of specific binding activity was measured. Data are expressed as the decrease of specific binding (mean±SE, n = 4 of two independent experiments) and *p<0.05 denotes significant statistical difference between the levels of CRF2 expressed in pre-adipocytes compared to the levels of CRF2 expressed in differentiated adipocytes; (b), The mRNA levels of CRF1 and CRF2 was measured in 3T3L1 pre-adipocytes and differentiated adipocytes by RT-PCR. Data are expressed as the fold difference of the mRNA levels of CRF1 or CRF2 expressed in pre-adipocytes (mean±SE, n = 4 of two independent experiments) and *p<0.05 denotes significant statistical difference between the levels of CRF2 expressed in differentiated adipocytes compared to the levels of CRF2 expressed in pre-adipocytes; (c), The mRNA levels of UCN2 and UCN3 were measured by PCR in mouse samples. Panel B, The mRNA levels of CRF receptor isoforms (column a) and CRF peptides (column b) were measured in human samples. Beta-Actin was used for control.

