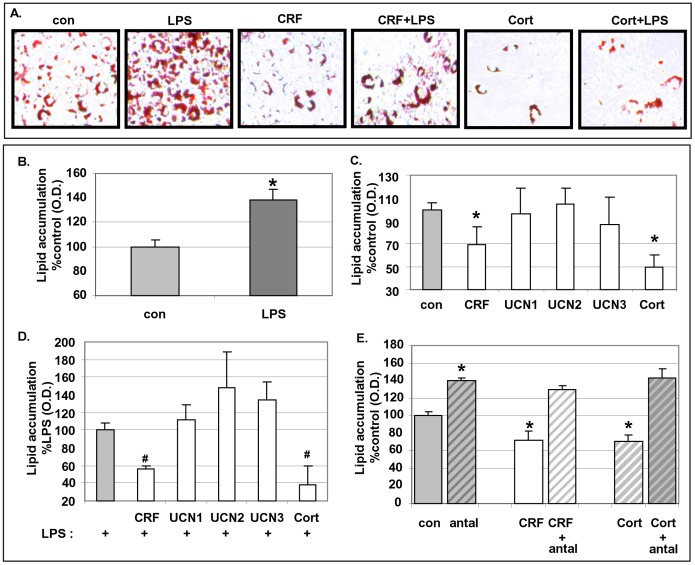
Figure 2. Effect of CRF agonists on the differentiation process of 3T3L1 cells.
Pre-adipocytes were exposed to CRF peptides and/or LPS during the differentiation period and stained with Oil-Red-O. Panel A, The accumulation of lipid droplets were visualized under a microscope; Panels B, C and D, The degree of differentiation was measured as the intensity of the absorbance read at 595 nm. Panel E, The accumulation of lipid droplets of cells pre-exposed to antalarmin (10−6 M) and to CRF or Cortagine at 10−8 M was measured as the intensity of the absorbance read at 595 nm. Data are expressed as percentage change compared with control values (Panels B, C, E) or compared with LPS (Panel D) (mean±SE, n = 8 of three independent experiments). *p<0.05 depicts the statistical significant difference from cells exposed only to vehicles, while #p<0.05 depicts the statistical significant difference from cells exposed to LPS alone.

