Fig. 7.

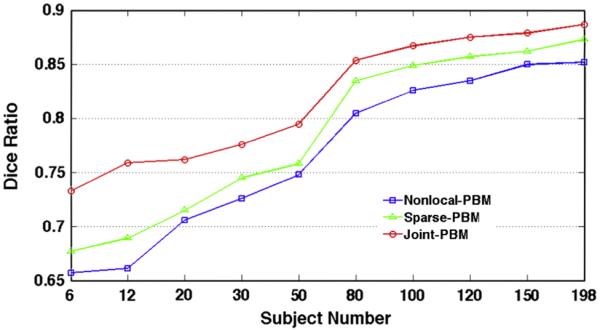
The evolution curves of Dice ratio w.r.t. the number of atlases used by Nonlocal-PBM (blue), Sparse-PBM (green), and Joint-BPM (red), respectively.

The evolution curves of Dice ratio w.r.t. the number of atlases used by Nonlocal-PBM (blue), Sparse-PBM (green), and Joint-BPM (red), respectively.