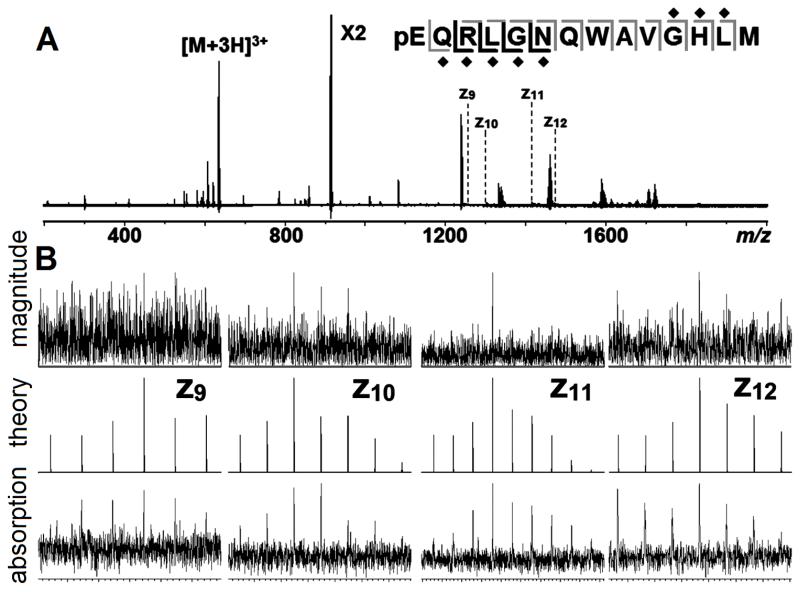
Figure 3.
(A): ECD spectrum of Ru binding bombesin, with the cleavage map. Fragments observed in magnitude-mode are in grey, new fragments in absorption-mode are in black, the Ru binding sites are labelled by diamond. (B): zoom in of fragment in magnitude (top), absorption-mode (bottom), and its isotope simulation (middle).

