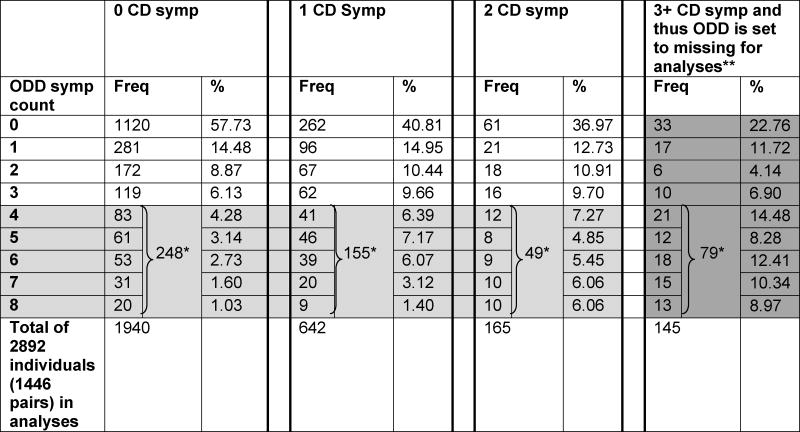
Table 2.
Two-way (CD and ODD) Contingency Table and Profiles of ODD symptom counts for each category of CD. The light gray shaded cells represent the 4+ ODD symptom category and are shown broken down by number of symptoms as well as the sum total. The dark gray shaded cells are not observable (i.e., represent structural missing data) because those with 3+ CD symptoms cannot be characterized on the ODD dimension.

|
Light gray shaded area is the 4+ ODD symptom category for our model fitting.
Dark gray shaded area explicitly shows the part of the table that is unobservable according to DSM-IV and thus may be considered to summarize structural missing data, because those with a CD diagnosis cannot be characterized on the ODD dimension.
