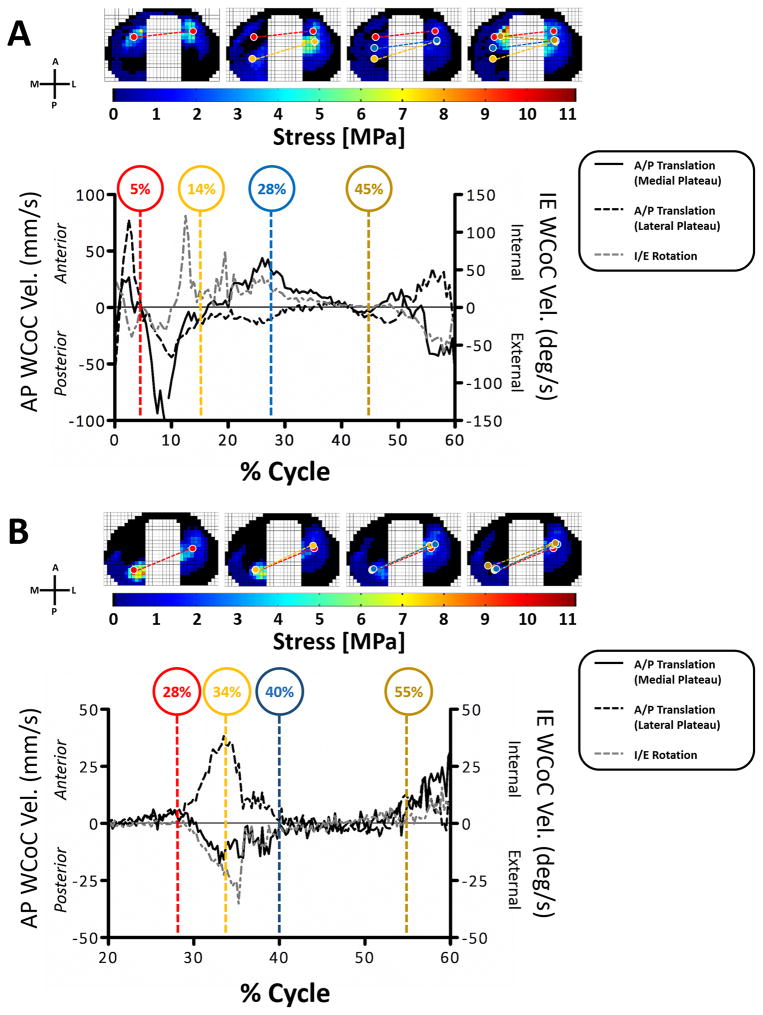
Figure 6. The weighted center of contact AP and IE velocities.
The average WCoC velocity during A) walking and B) stair climbing for all knees are shown in the graphs. The upper images show the stress magnitudes and WCoC locations on the medial and lateral plateaus (circles) for a representative knee. The color of the WCoC circles corresponds to the colors of the % cycle highlighted in the graphs.

