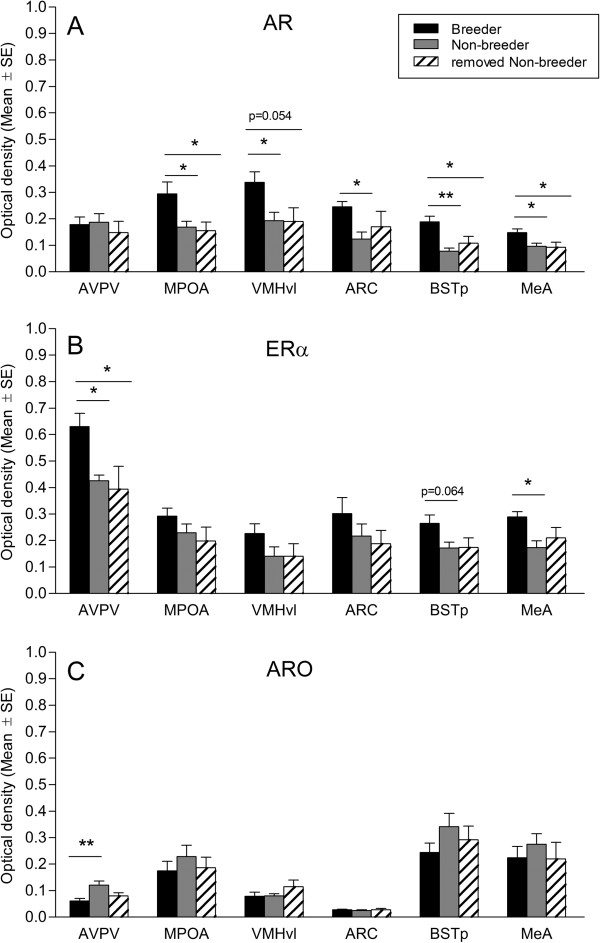
Figure 3.
Breeding status and social suppression affect the mRNA expression levels of AR, ERα and ARO. Average optical density of the hybridization signal for AR (A), ERα (B) and ARO (C) for different forebrain regions of female breeders, non-breeders and females that were isolated from their natal groups (removed non-breeder). ** p < 0.01; * p < 0.05.

