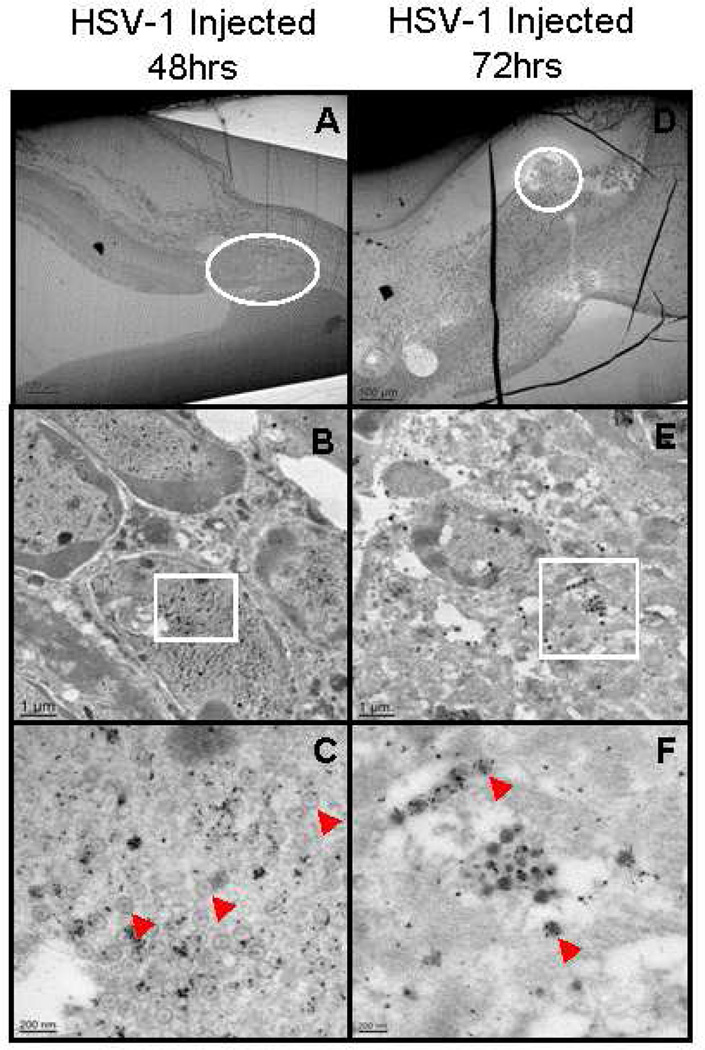
Figure 1.
Electron micrographs showing virus capsids (arrows) and virus proteins (identified by colloidal gold particles) in the cytoplasm and nucleus of cells in the anterior segment of the injected eye at 48 and 72hrs p.i. B and E, enlargement of area circled in A and D. C and F enlargement of boxed area in B and E. Original magnification: A and D – 50×; B and E – 5,000×; C – 25,000×, F – 20,000×

