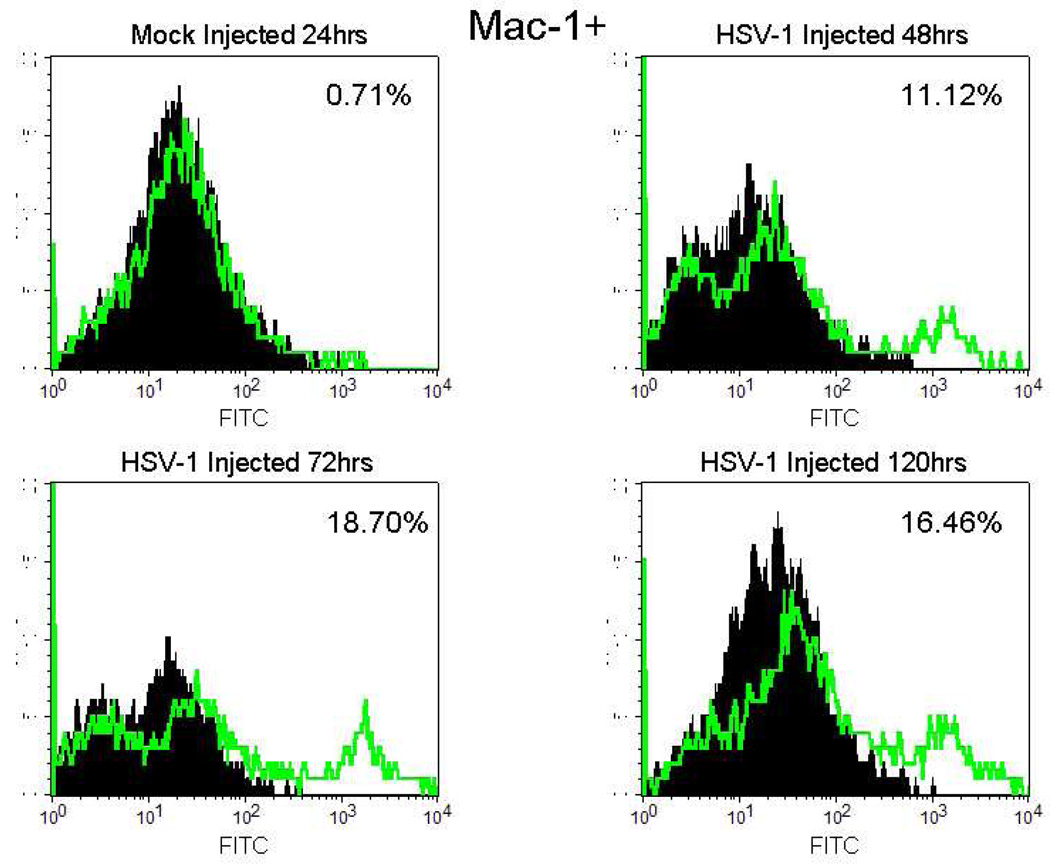
Figure 3.
Flow cytometric histograms of infiltrating cells isolated from mock injected mouse eyes at 24hrs p.i. and HSV-1 (KOS) injected eyes at 48, 72 and 120hrs p.i. Cells were stained with FITC-conjugated anti mouse Mac-1 (green line) or FITC-conjugated Rat IgG2b,κ (solid black). Results were analyzed by flow cytometry. Percentages are % of isotype matched control staining subtracted from % of cell marker staining. Data are representative of two independent experiments.

