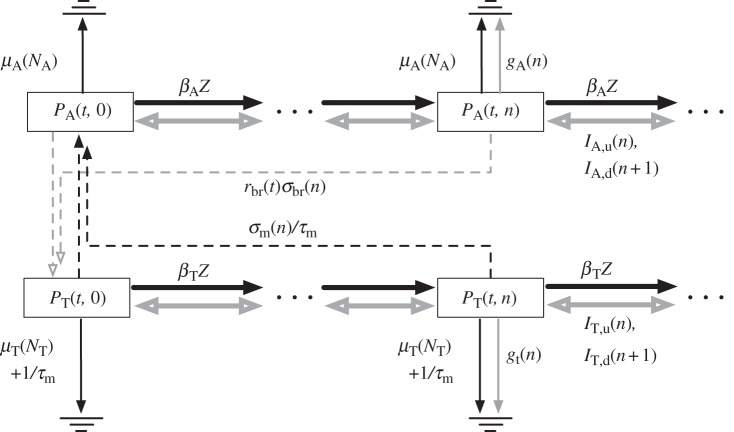
Figure 1.
Schematic of the dynamics for the DOI distributions of adults (2.1) and tadpoles (2.2). Dashed arrows correspond to adult and tadpole recruitment, thin full arrows to disease-independent and disease-induced deaths, thick black arrows to new infections and thick grey arrows to within-host disease dynamics.

