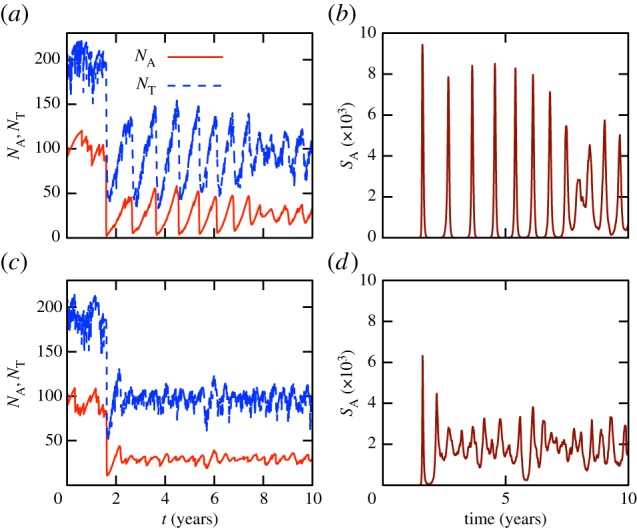
Figure 2.

Simulations of the stochastic model (one per row), leading to endemic states. Panels (a,c) show population sizes, panels (b,d) show the mean adult DOI. The breeding rate rbr and transmission rates  ,
,  are time-independent. Populations are exposed to Bd during the second year. (a,b) Tadpoles do not suffer from infection and have a long life time (τm = 1 year). The observed cycles are purely due to host-demographic delays, as Bd-intrinsic time scales are very short (μZ = 1 d−1,
  ). (c,d) Tadpoles strongly suffer from infection, but with otherwise identical parameters as in (a,b). Model parameters are given in the electronic supplementary material, table S1. (Online version in colour.)
