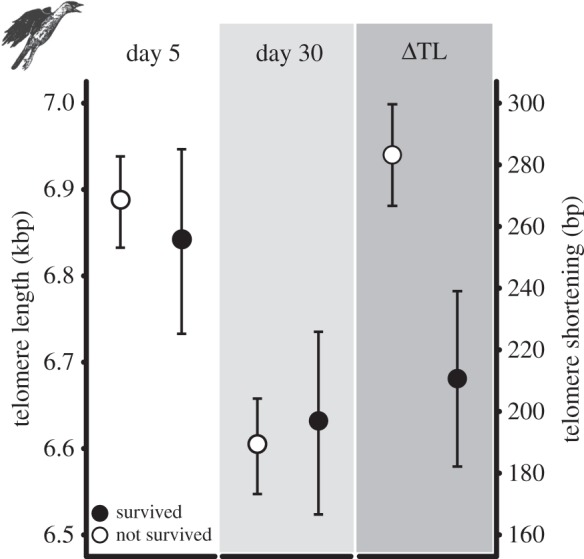
Figure 3.

Telomere length and telomere shortening (±s.e.) in relation to survival. Panels from left to right show telomere length at ages 5 days and 30 days, and the change in telomere length in the nestling phase (day 5–day 30) for survivors and non-survivors separately. See table 2 for statistical details.
