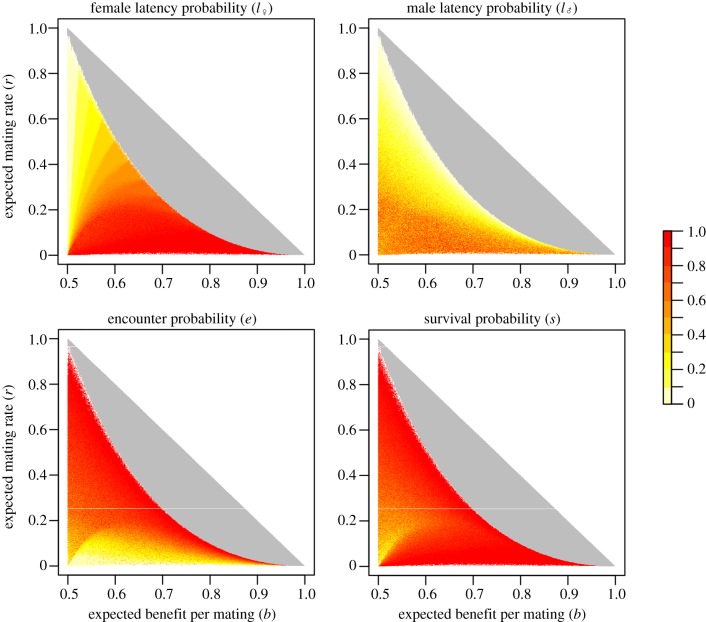
Figure 2.
The mean value of each parameter for the different values of the trade-off between mating rate and mating benefits at ESS. The mating rate r is plotted against the mating benefits b. The space below the diagonal (grey+coloured area) corresponds to the possible combinations of r and b, and the coloured area represents evolutionarily stable cases. The colour scale indicates the mean value of each parameter for all possible combinations of r and b at ESS, because the same combination can be attained by different sets of parameters. These figures have been obtained by calculating r and b in 108 cases that explore the entire range of the parameters (i.e. e, s, l♀ and l♂ varying between 0 and 1 whereas ϕ = ϕp = ϕ*). The quality of males follows a uniform distribution. (Online version in colour.)

