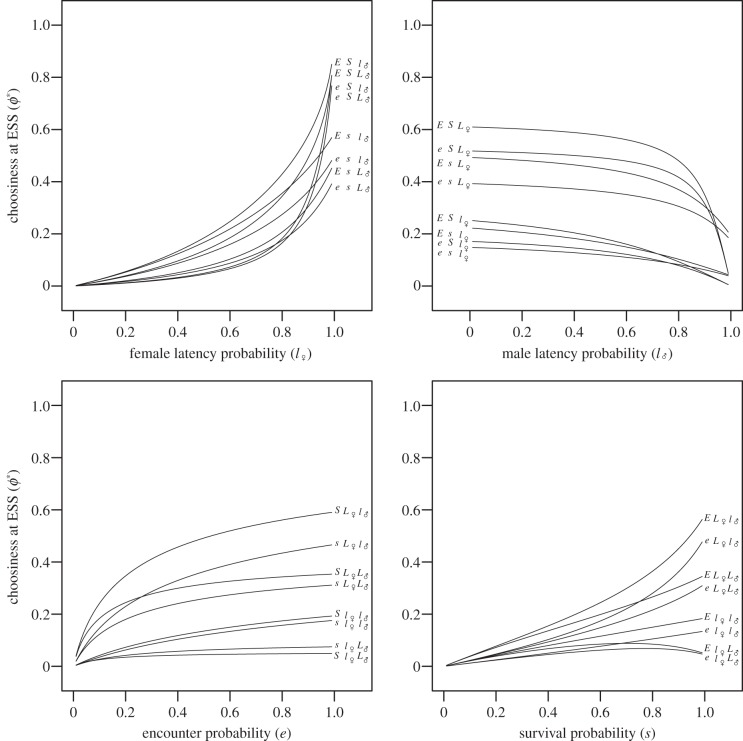
Figure 3.
The effect of parameters on choosiness at ESS. The value of choosiness at ESS ϕ* (y-axis) is plotted against each parameter (x-axis). For each graph, the three other parameters vary between two values: 0.5/0.9 for e, l♀ and l♂ and 0.9/0.999 for s. Parameters set to the higher value are written in capital letters.

