
Figure 5.
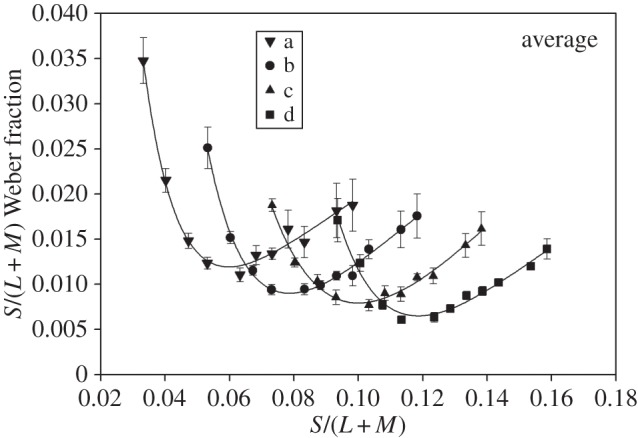
Average values for the S-cone contrast at threshold plotted against the S/(L + M) value of the referent. Each of the datasets corresponds to one of the four lines a–d shown in figure 1b. The fitted functions are inverse third-order polynomials. Note that the minima of the functions do not coincide, as would be expected if discrimination depended on a chromatic channel that extracted the ratio S/(L + M).