
Figure 6.
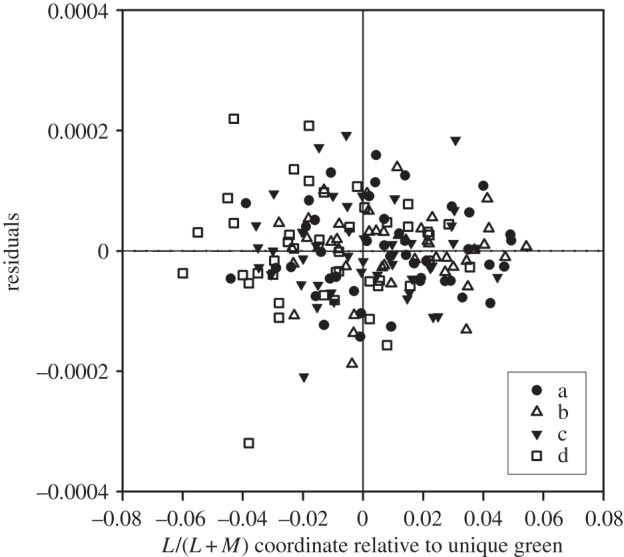
Residuals relative to the functions fitted to the individual data in figure 2. Data points are plotted separately for each referent on each line (a, b, c, d) for each observer. Each subset of data for a given observer and a given line have been plotted relative to the L/(L + M) value of the observer's own estimate of unique green (indicated by the vertical line in the centre of the plot). The near-horizontal line is the quadratic that best fits all the data points. There is no indication of a local minimum near unique green.