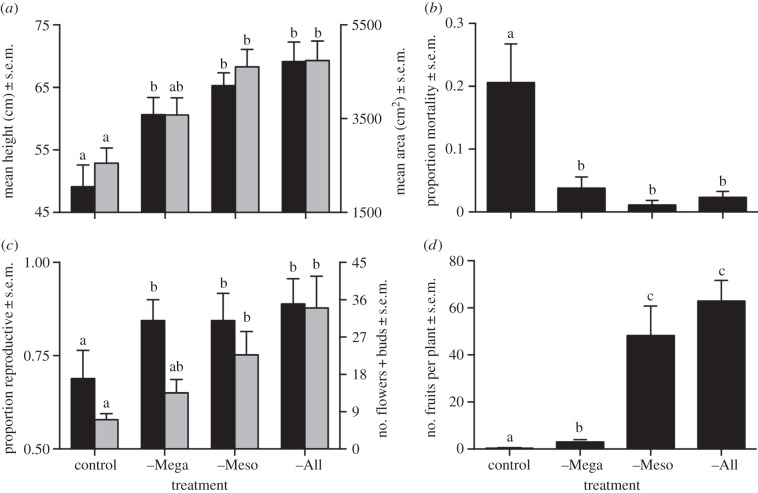
Figure 2.
Individual-level responses to browser exclusion. (a) Mean height (black bars) and canopy area (grey bars), June 2012. (b) Proportional mortality, April–June 2012. (c) Probability of reproduction (black bars) and estimated reproductive output (grey bars), September 2011. (d) Standing fruit crop, February 2011. Letters show significant differences.

