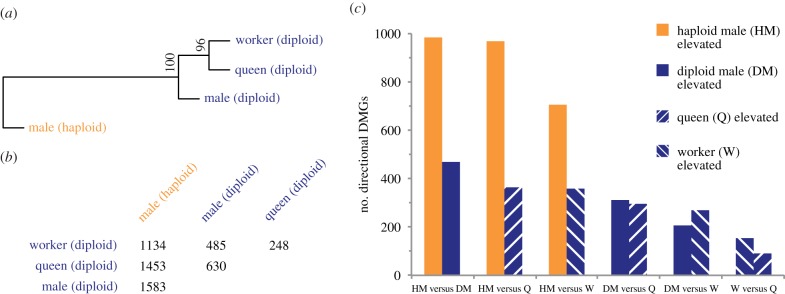
Figure 1.

DNA methylation differs between haploid and diploid castes in S. invicta. (a) Dendrogram produced by hierarchical clustering of fractional methylation levels representing all introns and exons targeted by DNA methylation in at least one library (n = 10 560 genetic features); bootstrap probability values are shown. (b) Number of differentially methylated genes (DMGs) detected between castes. (c) Number of directional DMGs from panel (b) that exhibit pairwise elevated methylation in haploid and diploid castes. (Online version in colour.)
