
Figure 1.
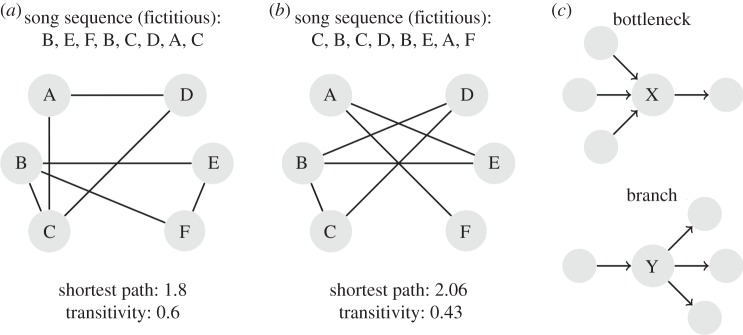
(a,b) Illustration of network measures. The exemplarily sequences depicted in (a,b) result in different values of transitivity (connected nodes) and shortest paths (minimal number of nodes between any two song types). (a) High transitivity value due to a high proportion of triangular-shaped connections, for example A,D,C and B,E,F. (b) Only one triangle (→ lower transitivity), but high shortest path value due to the long ways needed to connect C and D with F. (c) Transition properties of particular song types: bottleneck (X) and branch (Y).