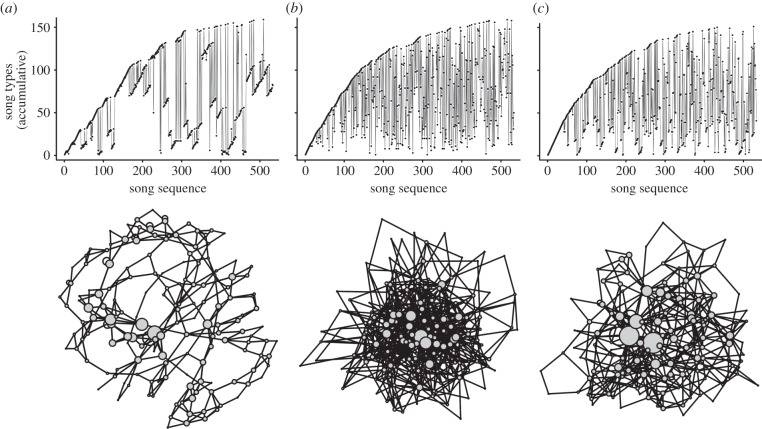
Figure 2.
(Top) Cumulative repertoire curves. Five hundred and thirty-three subsequent songs (about 1 h) of nocturnal nightingale song. X-axis: position of the song in sequence. Y-axis: different song types. (a) Bird ‘id 7’ (table 1), singing ordered. (b) Song sequence of bird ‘id 7’ (table 1) in an order randomized version. (c) Bird ‘id 5’ (table 1) singing ‘disorderly’. (Bottom) The same song sequences in network presentation (layout ‘Fruchterman–Reingold’): circles (nodes) = song types (size refers to song type frequency), lines (edges) = transitions of song types. Bird ‘id 5’ 151 nodes, 533 edges; bird ‘id 7’ 159 nodes, 533 edges.

