
Figure 3.
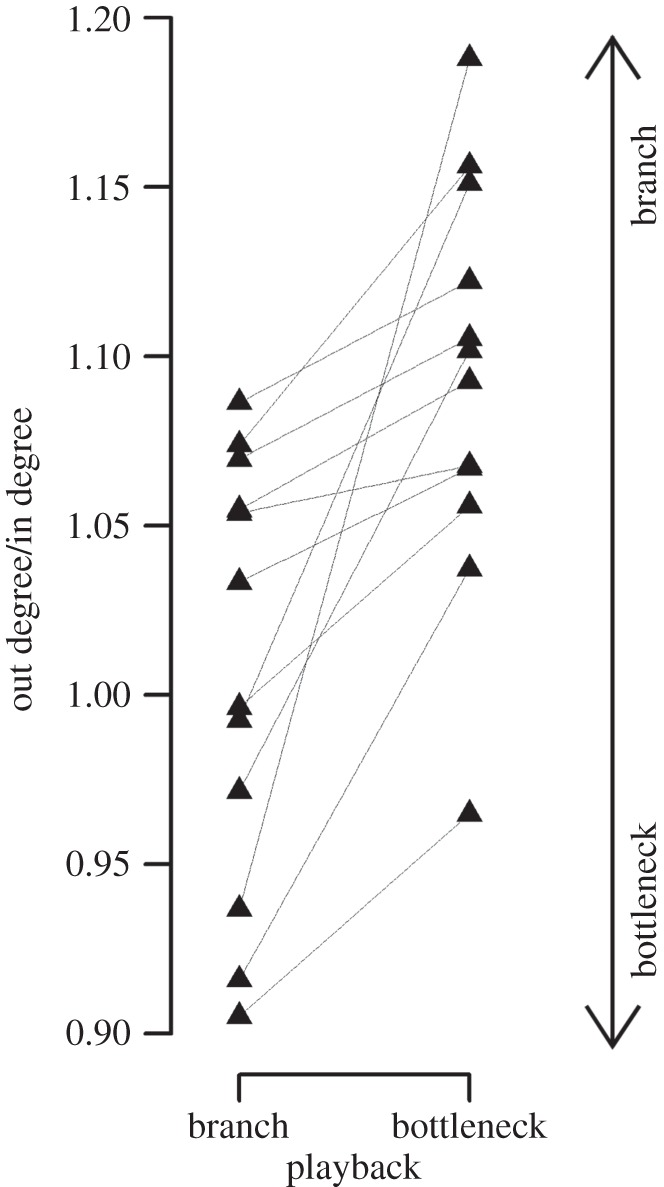
Response to playbacks containing song types with branch or bottleneck transition patterns (each triangle represents the mean per playback for one bird, the two values of each bird are connected by a thin line). Birds sang more ‘branch song types’ when hearing bottlenecks and vice versa (n = 12, exact Wilcoxon signed-rank test, W = 0, p < 0.001). High out degree together with low in degree values (proportion above 1) characterize branches and low out degree together with high in degree values (proportion below 1) define bottlenecks.