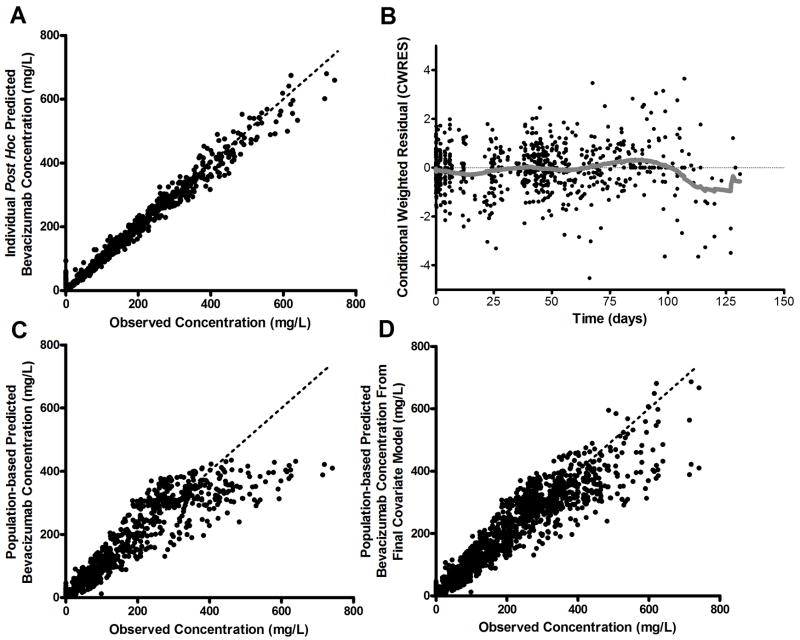
Figure 1.
Goodness-of-fit plots from the bevacizumab population pharmacokinetic model (model parameterization [B]). A, Observed versus individual predicted concentrations for the covariate-free (base structural) model. B, Conditional weighted residual (CWRES) versus time in days for the covariate-free model with LOWESS (solid line). C, Observed versus population predicted concentrations for the covariate-free model. D, Observed versus population predicted concentrations for the final population model. Dashed lines in panel A, C, and D represent the line of unity.

