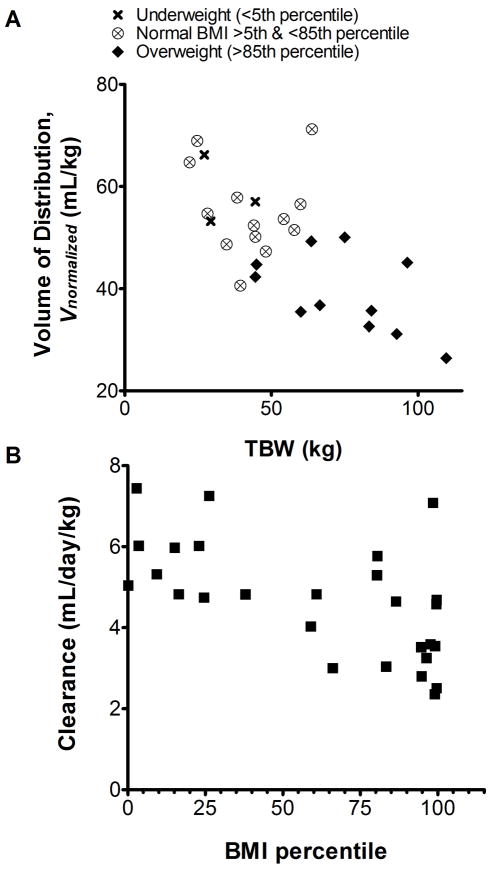
Figure 2.
A, The plot of bevacizumab Vnormalized (weight normalized volume of distribution from parameterization [B]) versus total body weight (TBW) implies an apparent non-linear relationship between TBW and Vnon-normalized. In cases of extreme body weight, the Vnormalized of bevacizumab was up to 53% lower (BMI > 97th percentile) or up to 32.1% higher (BMI < 3rd percentile) than the population median value. B, The trend in the scatterplot of CL versus BMI percentile further confirms that body composition is a key determinant of pharmacokinetic interindividual variability when bevacizumab is dosed on a TBW-based regimen.

