
Figure 2. Optogenetic identification of interneurons.
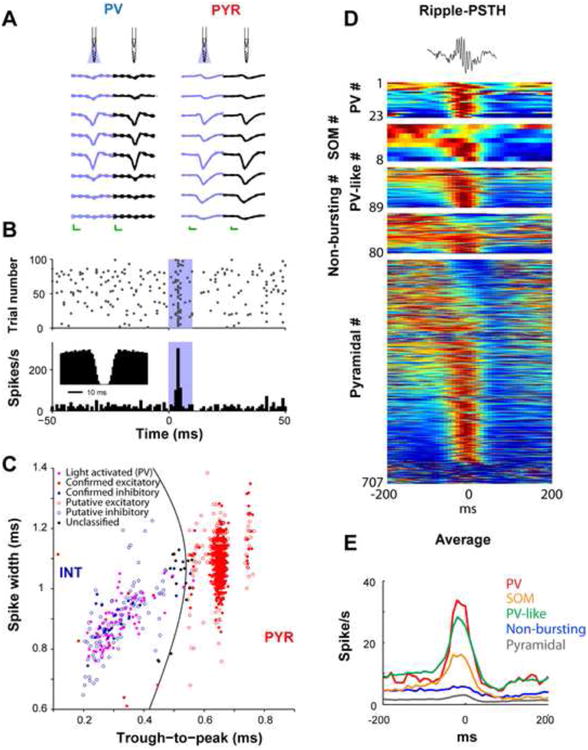
A. Right: unfiltered spontaneous (black) and light-induced (blue) waveforms of a parvalbumin-expressing interneuron (PV) and a pyramidal cell (PYR) at eight recording sites. Note the similarity of the waveforms with and without illumination. Mean and SD; calibration: 0.25 ms, 50 μV. B. Diode probe-induced unit firing in the hippocampal CA1 region (blue shaded area superimposed on the raster plot -top-and the histogram -bottom-; 4 μW at fiber tip). Inset: autocorrelogram shows a shape typical for fast spiking PV interneurons. C. Clustered units are tagged as excitatory or inhibitory based on monosynaptic peaks/troughs in cross-correlation histograms (filled blue and red symbols) and/or response to locally-delivered 50-70 ms light pulses (filled violet symbols) in transgenic mice expressing ChR2 in PV cells. Untagged units (empty symbols) are classified as putative excitatory pyramidal cells (PYR) or inhibitory interneurons (INT) according to waveform morphology; untagged units with low classification confidence are also shown in black (“unclassified”) [18]. D. Optogenetic identification of interneuron classes, including here PV-and somatostatin (SOM)-expressing interneurons, allows studying their relationships to network patterns such as sharp wave ripple events. Top: single ripple. Each row represents the color-coded peri-ripple histogram of the firing rate computed for individual neurons. E. Average firing rate observed for the different cell categories. (B) Reproduced from [49]. (C) Reproduced from [18]. (D and E) Reproduced from [41].