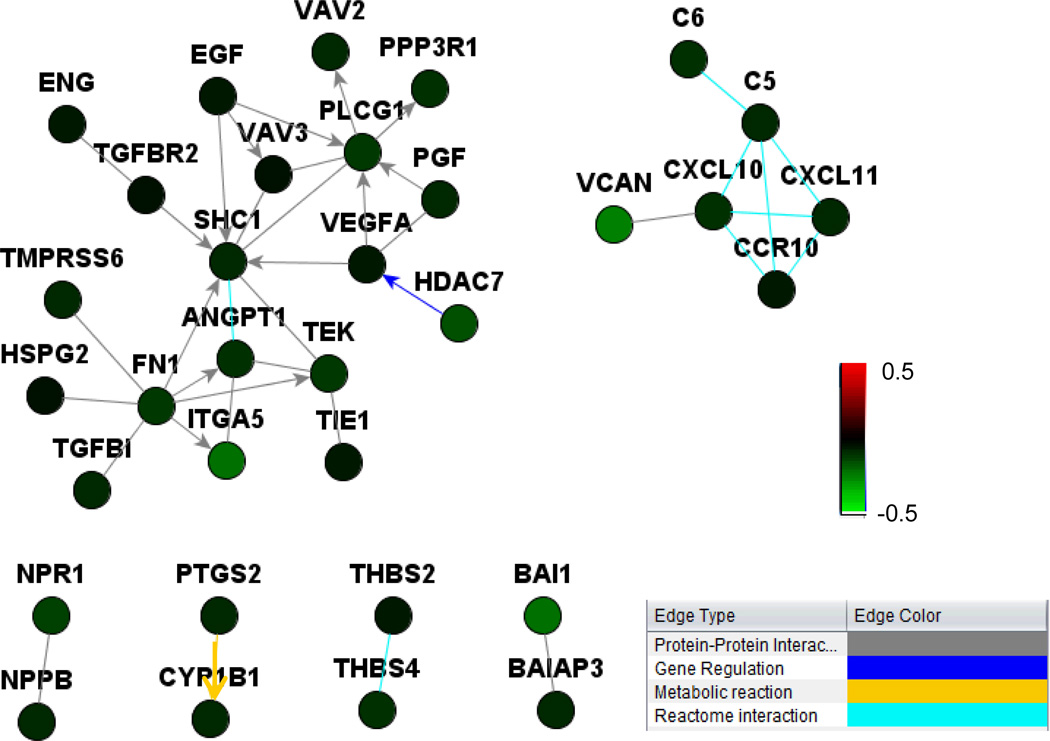
Figure 6. Network analysis of angiogenesis factors differentially regulated by 3G3 treatment in PDGFRa- positive cells (HEC-1A) and PDGFRa-negative cells (RL95-2).
Netwalker analysis showed that angiogenesis factors (e.g., VEGFA, HADC7, ITG, and VCAN) were down-regulated by 3G3 treatment in PDGFRa-positive cells, but not in PDGFRa-negative cells. Coloring is based on the log-ratio of expression levels for 3G3+PDGF-AA treatment over PDGF-AA treatment. Gene-expression differences were considered statistically significant if the P values were less than 0.001. A stringent significance threshold was used to limit the number of false-positive findings.

