Figure 4.

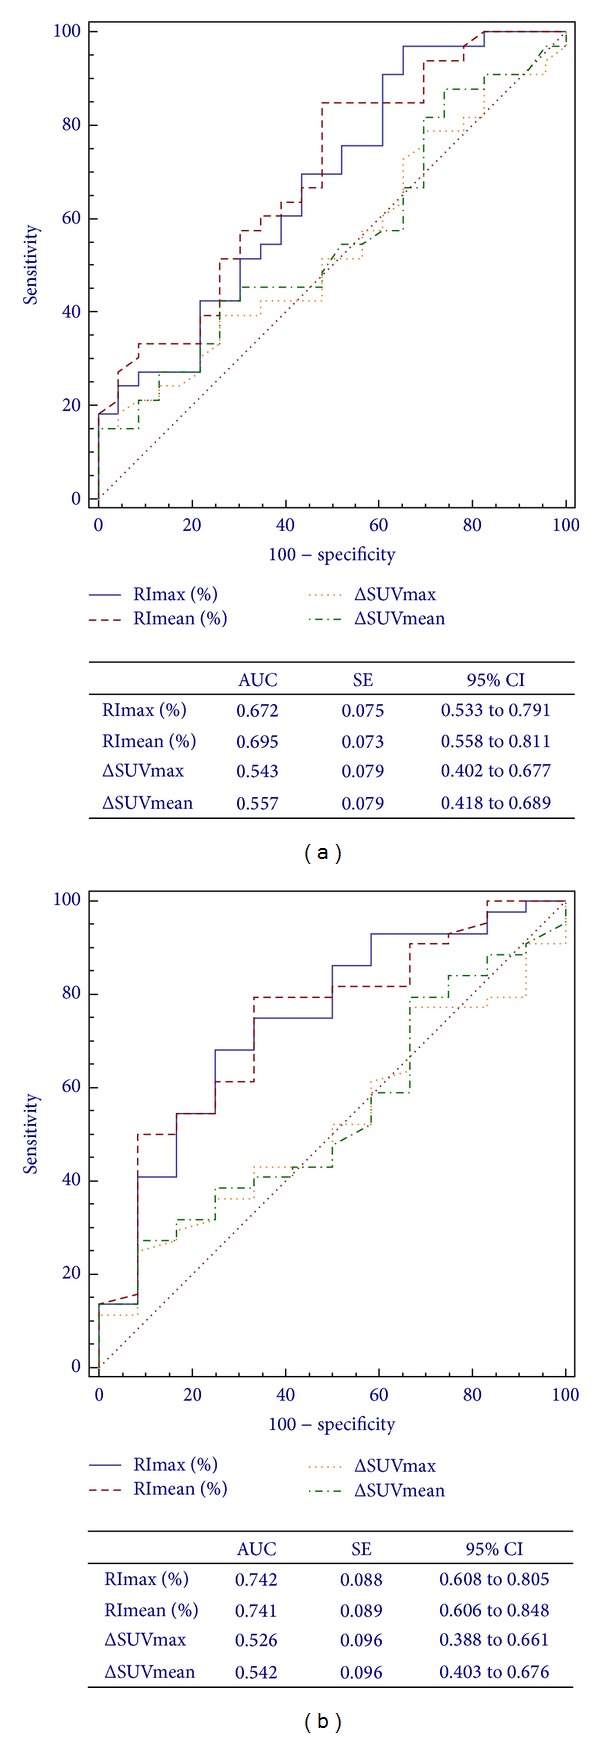
ROC curves for 18F-FDG PET/CT assessment of ΔSUVmax, ΔSUVmean, RImax, and RImean in predicting response to CRT based on Mandard's TRG (a) and the (y)pTNM (b) criteria.

ROC curves for 18F-FDG PET/CT assessment of ΔSUVmax, ΔSUVmean, RImax, and RImean in predicting response to CRT based on Mandard's TRG (a) and the (y)pTNM (b) criteria.