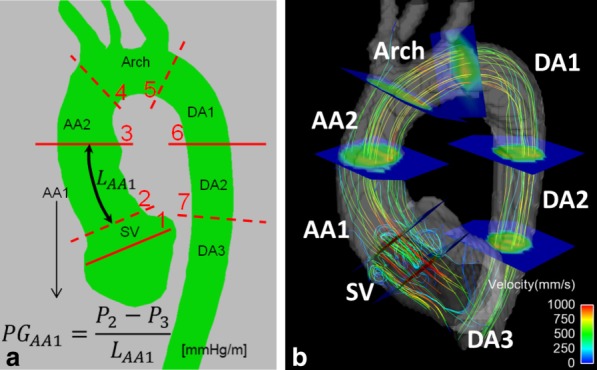
FIG 2.

a: Definition of the seven aortic anatomical regions (Sinus of Valsalva – SV; ascending aorta – AA1 and AA2; arch; and descending aorta – DA1, DA2, DA3) and their average pressure gradient (PG): the pressure difference between bounding planes (planes numbered 1 to 7) is divided by the length of the aortic segment of the region (LAA1 in the example illustrated). b: Illustration of the result of the placement of bounding planes in one case, highlighting the vortical flow at SV that is used to define planes 1 and 2. [Color figure can be viewed in the online issue, which is available at http://wileyonlinelibrary.com.]
