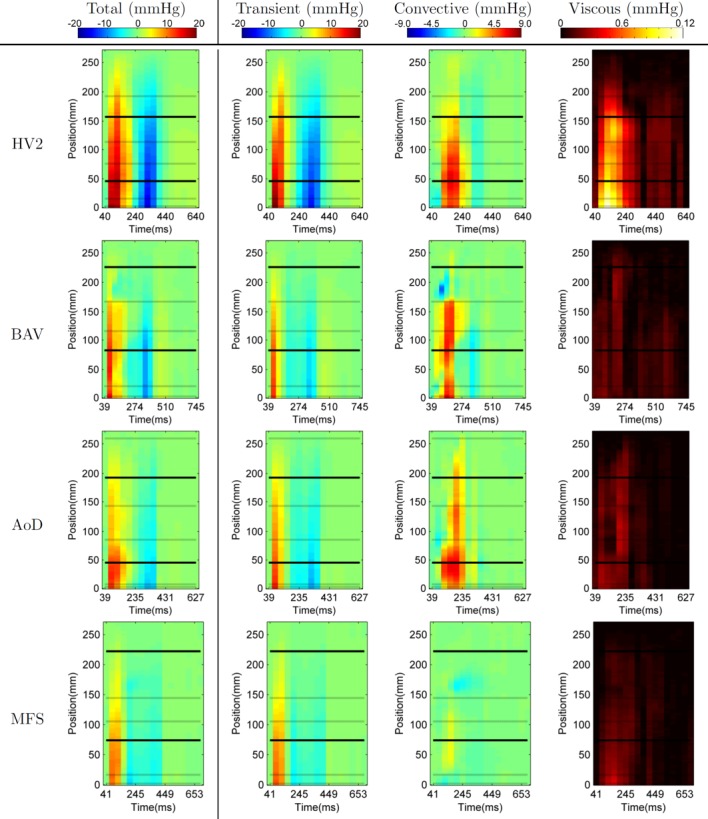
FIG 3.

Spatiotemporal maps of relative pressure in the one representative healthy volunteer (HV2) and the three patients, showing the average pressure alongside the length of the aorta (Y axis) through time (X axis). Horizontal lines correspond to the location of the planes dividing the anatomical regions in the aorta (see Figure 2). Note that the scale of each pressure component is different.
