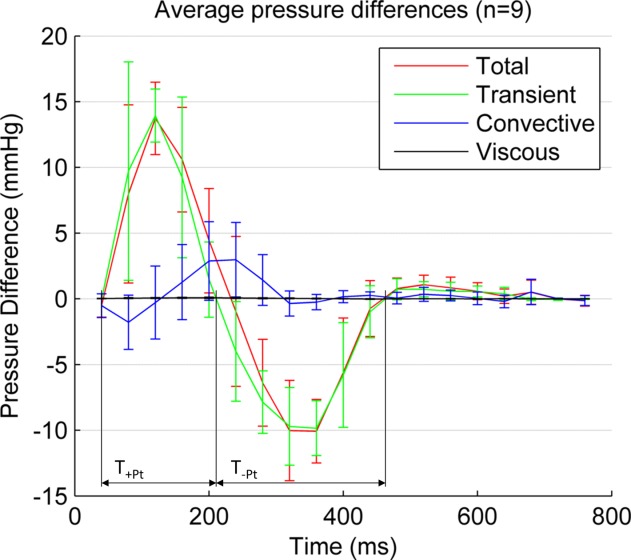
FIG 4.

Average temporal evolution of aortic relative pressure between the aortic valve plane (plane 1 in Figure 2) and the descending aorta (at a distance of 270 mm) in the nine healthy volunteers, decomposed in its three components: transient, convective and viscous. Confidence intervals indicate mean ± 1 std. Peak value of the transient component (14.1 mmHg) occurs at the instant of peak acceleration, and peak values of convective (2.9 mmHg) and viscous (0.08 mmHg) at the instant of peak velocity (acceleration and velocity magnitude transients are not shown for better clarity). +TPt and −TPt are the duration of the positive and negative two phases of the transient component of pressure. [Color figure can be viewed in the online issue, which is available at http://wileyonlinelibrary.com.]
