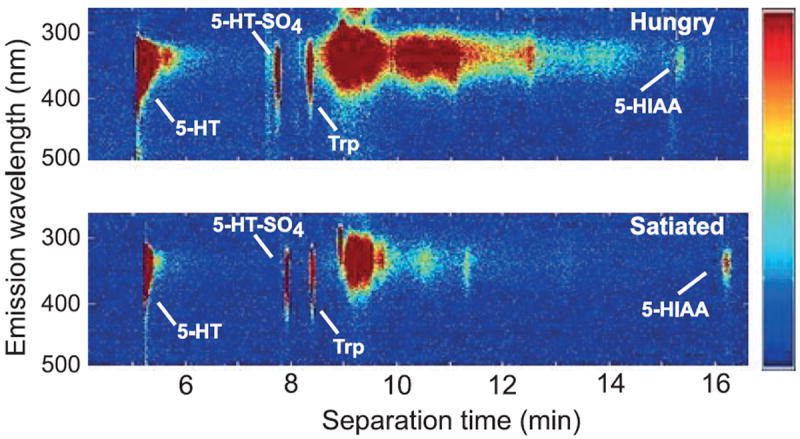
Fig. 1.

Single cell wavelength-resolved fluorescence capillary electropherograms from metacerebral giant neurons of paired hungry (upper) and satiated animals (lower). Besides the identifiable compounds 5-HT, 5-hydroxyindole acetic acid (5-HIAA), serotonin sulfate and tryptophan (Trp), a broad band of fluorescence emission represents Trp- and Tyrosine-containing proteins with an intensity that varied from animal to animal but did not significantly correlate with hunger state. Slight differences in analyte position (e.g., 5-HIAA) between electropherograms result from small differences in flow rate between runs. The color scale shows relative intensity of fluorescence emission (scale bar on right).
