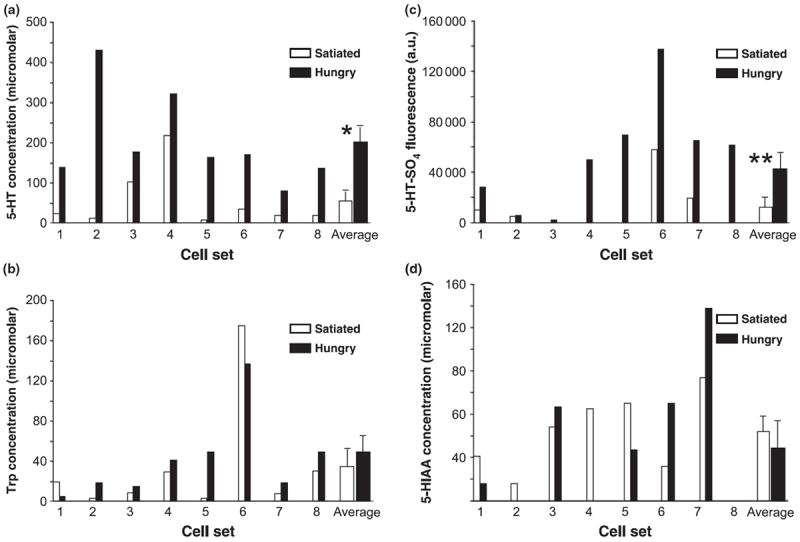
Fig. 2.

Histograms of (a) serotonin (5-HT), (b) tryptophan (Trp), (c) serotonin sulfate (5-HT-SO4), and (d) 5-hydroxyindole acetic acid (5- HIAA) levels from metacerebral giant neurons of hungry and satiated animal pairs. 5-HT-SO4 levels are presented as fluorescence intensities (arbitrary units). Hungry animals had significantly higher levels of 5-HT and 5-HT-SO4 than their satiated partners, while neither 5-HIAA nor Trp tracked hunger status. *p < 0.008, two-tailed paired t-test; **p = 0.003, two-tailed paired t-test.
