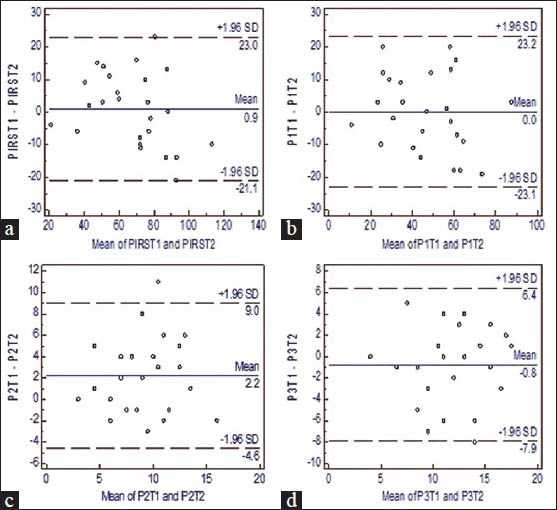
Figure 1.

(a) Bland-Altman plot of PIRS mean + SD. PIRS T1 is the test and PIRS T2 is retest value. (b) Bland-Altman plot of Distress score mean + SD.P1 T1 is the test and P1 T2 is retest value. (c) Bland-Altman plot of Sleep parameters mean + SD.P2T1 is the test and P2T2 is retest value. (d) Bland-Altman plot of Quality of life mean + SD.P3T1 is the test and P3T2 is retest value
