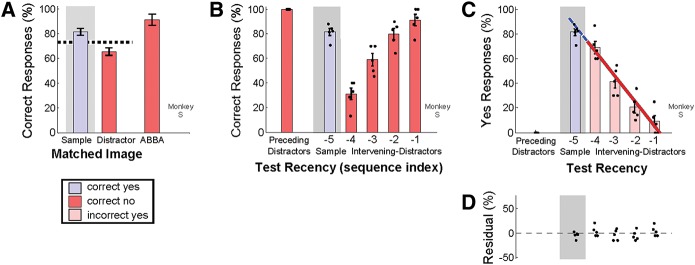
Figure 2.

Pilot Match First response rates depend linearly on recency. Performance of one monkey (“S”) on six-image sequences (one sample + four distractors + one test) during a pilot Match First experiment (15 daily sessions; 10% of trials were six-image sequence, 100 available images, all images presented for 1 sec; for trials where the test matched a distractor image, 5% were preceding distractors, and the remaining were equally distributed among intervening-distractor indices). (A) Percent correct: overall (dashed line), and for trials in which the test matched the sample, any distractor, or just the last distractor in the sequence (the ABBA-like condition, which in our task would be an ABCDEE trial). (B–D) Same dataset as A, but with trials sorted by test recency and performance reported as percent correct (B) or percent yes responses (C). Session data (points in B–D) are computed from three consecutive testing days for sufficient numbers of trials to estimate performance at each index. (C) Linear regression of response rates at the intervening-distractor indices (–1 to –4, red line) is projected to the sample index (–5, dashed blue line) to compute the predicted residuals (D).
