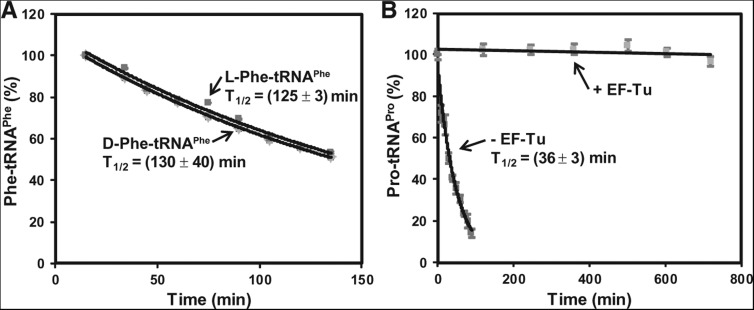
FIGURE 4.
Effects of enantiomerism and EF-Tu on acyl linkage stability. (A) Analysis of the hydrolytic decay of the D- and L-form of Phe-tRNAPhe over time. The calculated T1/2 for each is indicated. The concentration of Phe-tRNAPhe was as follows: L-Phe-tRNAPhe (0.29 µM), D-Phe-tRNAPhe (1.5 µM). (B) Analysis of the hydrolytic decay of Pro-tRNAPro (0.2 µM) over time in the presence and absence of EF-Tu (9 µM). The calculated T1/2 in the absence of EF-Tu is shown. The concentration of Pro-tRNAPro in each reaction was as follows: with EF-Tu (0.3 µM) and without EF-Tu (0.18 µM).

