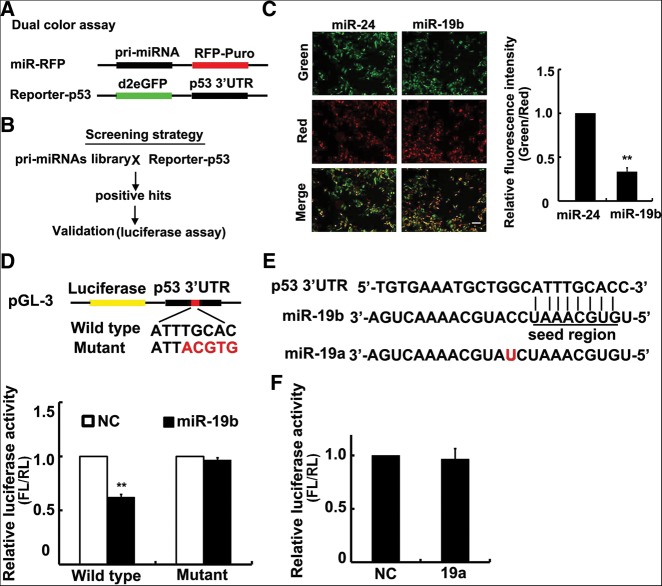
FIGURE 1.
miRNA-19b directly targets p53. (A,B) Diagram of plasmids design (A) and screening strategy (B). (C) Partial result of dual-color screening. Overexpression of miR-19b sufficiently decreased d2eGFP production, whereas miR-24 had no significant effect. Quantitative data of the relative RUE is shown on the right. Scale bar, 20 μm. (D) Validation of screening results by luciferase assay. The diagram shows the wild-type p53 3′ UTR and the different nucleotides in the mutant plasmid. Luciferase assay results are shown below. miR-19b repressed luciferase activity with the wild-type p53 3′ UTR in Hela cells, but not the mutant UTR. (E) Sequence comparison of miR-19b and miR-19a. The red character denotes a single differing nucleotide. (F) Luciferase assay for p53 3′ UTR in Hela cells transfected with miR-19a. miR-19a did not affect luciferase activity via p53 3′ UTR. (FL) Firefly luciferase; (RL) Renilla luciferase. All histograms are presented as mean values ± SEM from five independent experiments. Data are tested by a Mann-Whitney test.

