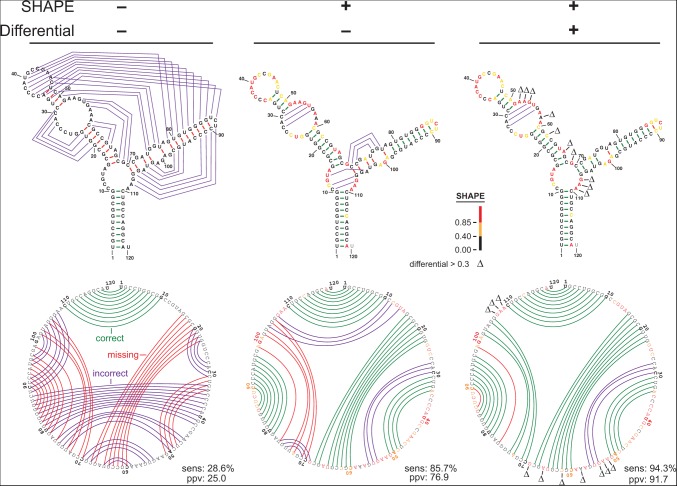
FIGURE 3.
Representative secondary structure modeling for the 5S rRNA without and with SHAPE data. Base pair predictions are illustrated with colored lines (green, purple, and red denoting correct, incorrect, and missing base pairs, respectively) on conventional secondary structure representations (top) and circle plots (bottom). Nucleotides are colored according to their SHAPE reactivity on a black, yellow, red scale for low, medium, and strong reactivity. Nucleotides showing strong preferential reactivity with NMIA (>0.3 units) are indicated with a Δ symbol.

